Quick Links
Download Power BI dashboard templateOpen and configure Power BI dashboard
Set Power BI dashboard datasource settings
Publish Power BI dashboard
Configuring Power BI online settings
Download Power BI dashboard template
Click on the PowerBI file icon in order to connect to your data:

Before Starting: Obtain a personal access token via On-Road IoT as described here. Remember a personal access token is linked to your user account and should be used with the same sense of security as for usernames and passwords.
Open and configure Power BI dashboard
In this section we will walk through connecting and getting data from the Customer Insights API using Power BI.
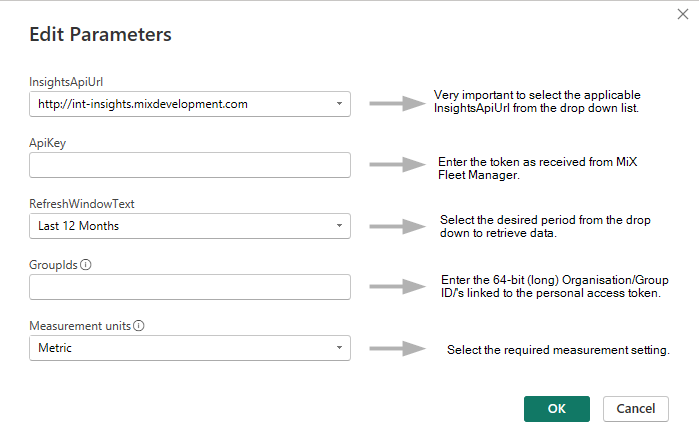
Open the sample workbook and fill in the required fields:
The parameters and queries are already included in this workbook. When opening the workbook a dialog will appear to configure the data source.
The following parameters are required:
| InsightsApiUrl | Please make sure you select the correct URL in the drop down list for the environment where your username exists. |
| ApiKey | The API key (Personal Access Token) received from On-Road IoT. |
| RefreshWindowInMonths | The duration in months of data to be loaded. These periods are available in the dropdown on the parameter screen: 3,6,9 and 12 |
| GroupIds | The ID of the organisation. |
| Measurement units | Select the required measurement unit applicable to your organisation/s ie. Metric, Imperial UK or US |
Image below shows the 5 parameters that need to be entered.
Follow the instruction below:
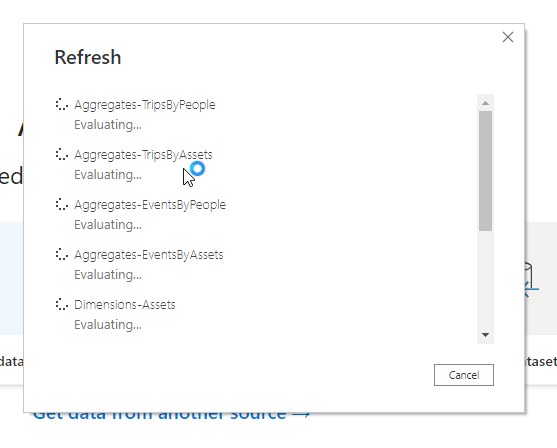
Click the Load button to continue loading requested data into workbook.
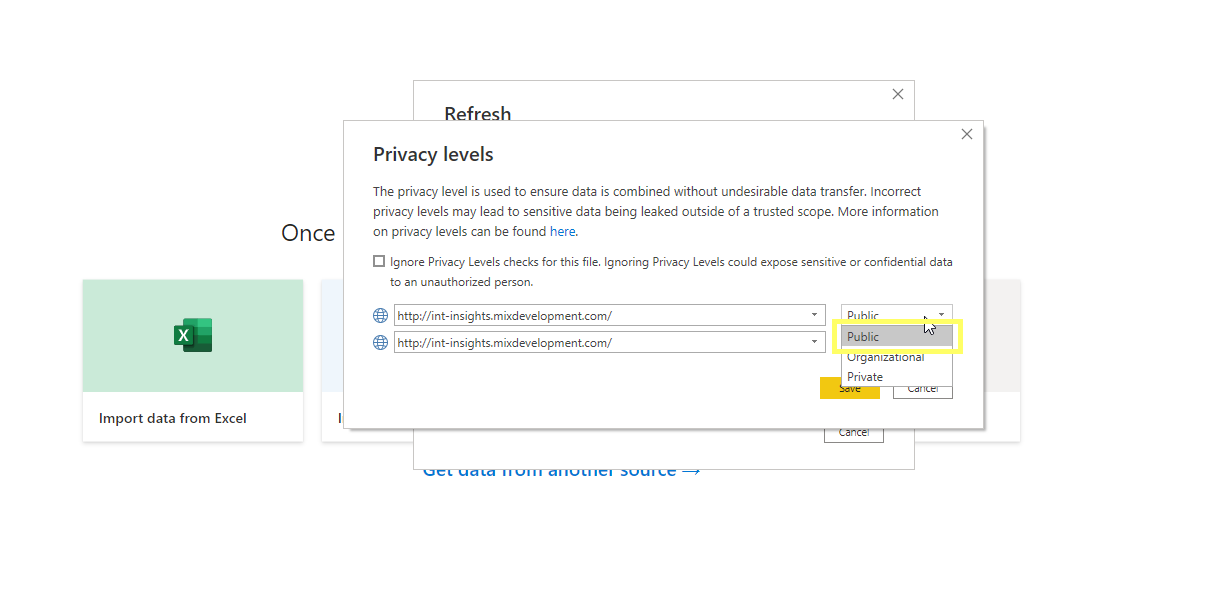
If the following screen appears, select the "Public" option next to the site address.
If the screen does not appear, the correct privacy levels will be set in the next step.
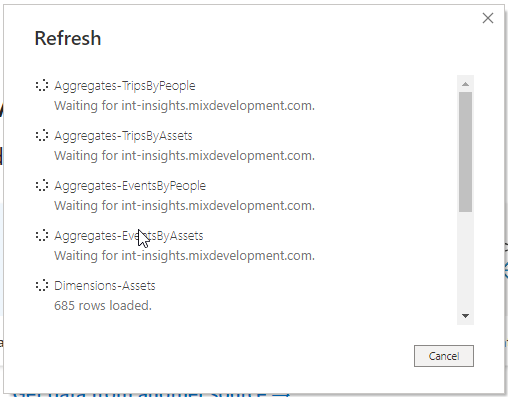
The data will continue to load.
Set Power BI dashboard datasource settings
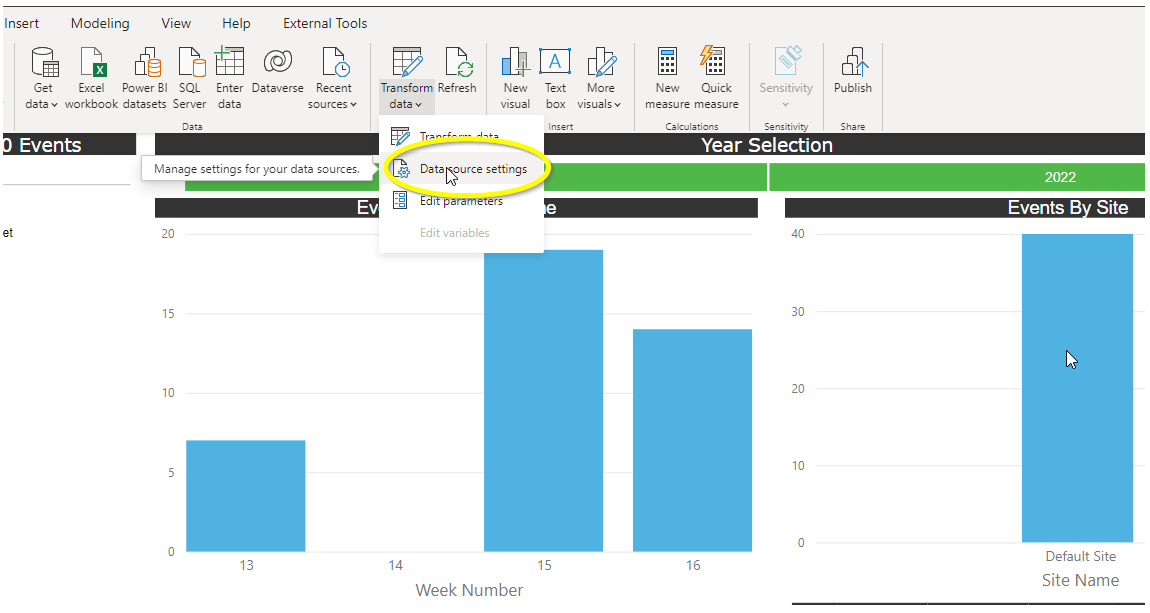
Select the Datasource settings menu as indicated below.
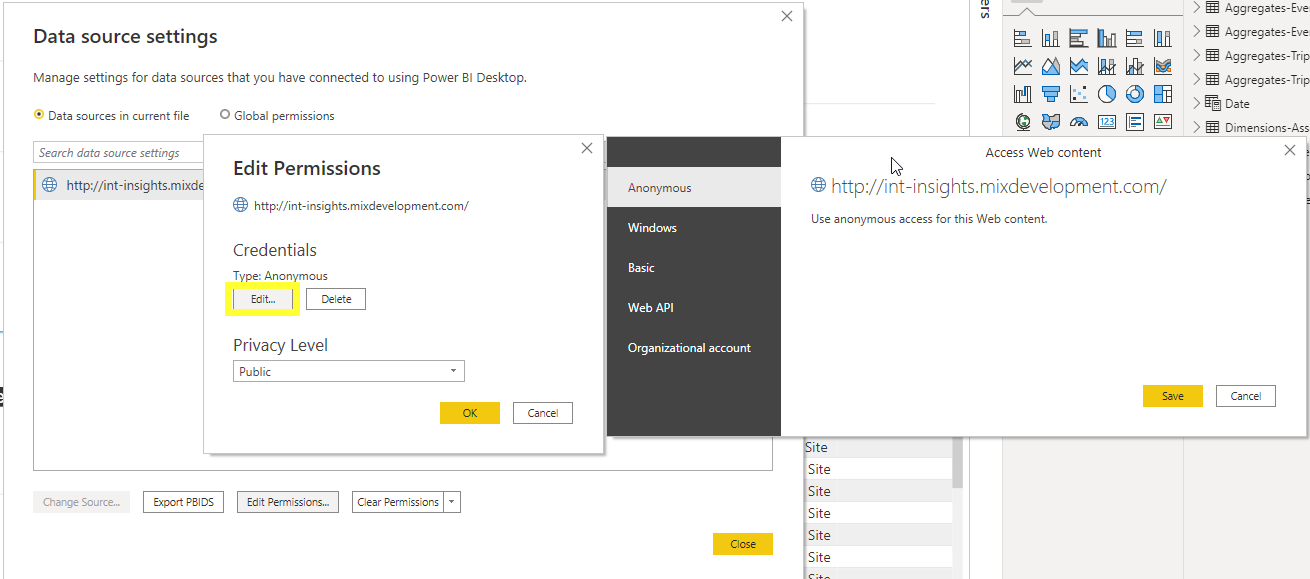
Click on the "Edit Permissions" button as indicated below.
Click on the "Edit Credentials" button as indicated below. Make sure Anonymous is the selected option.
This setting will later be used on the online setup of this report.
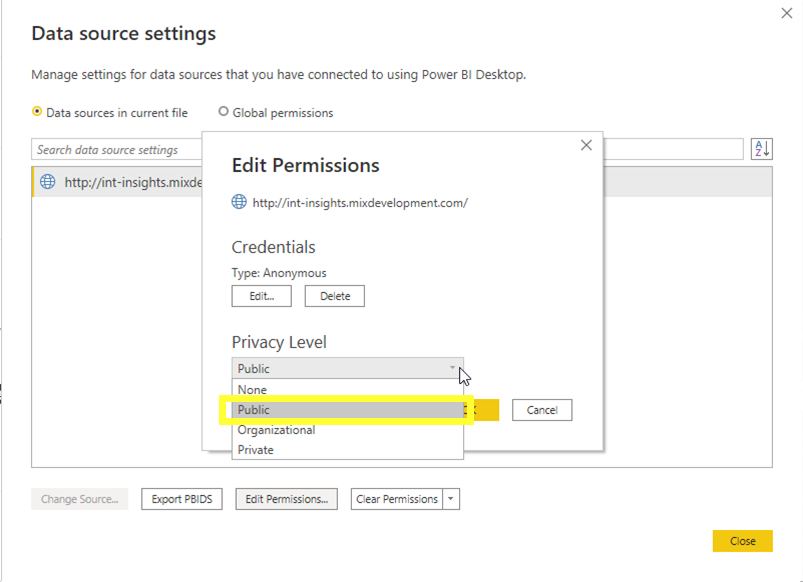
Select "Public" from the Privacy Level drop-down as indicated below.
The report is now ready to be saved in order to publish to Power BI online.
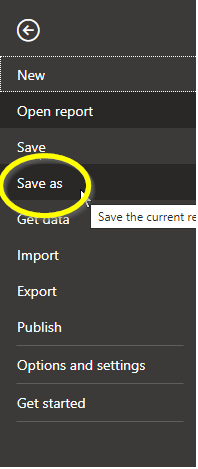
Select the "Save as" option from the File-menu as indicated below. Give the report a unique and meaningful name.
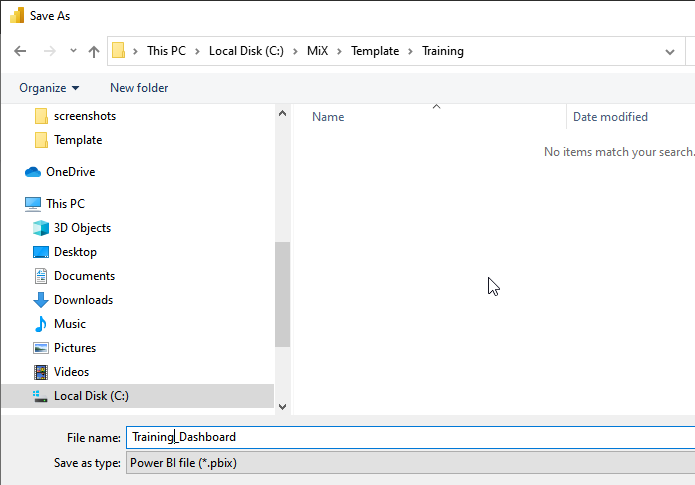
Select a location/directory to save the new Power BI file. An example from the image below is called "Training_Dashboard.pbix".
Publish Power BI dashboard
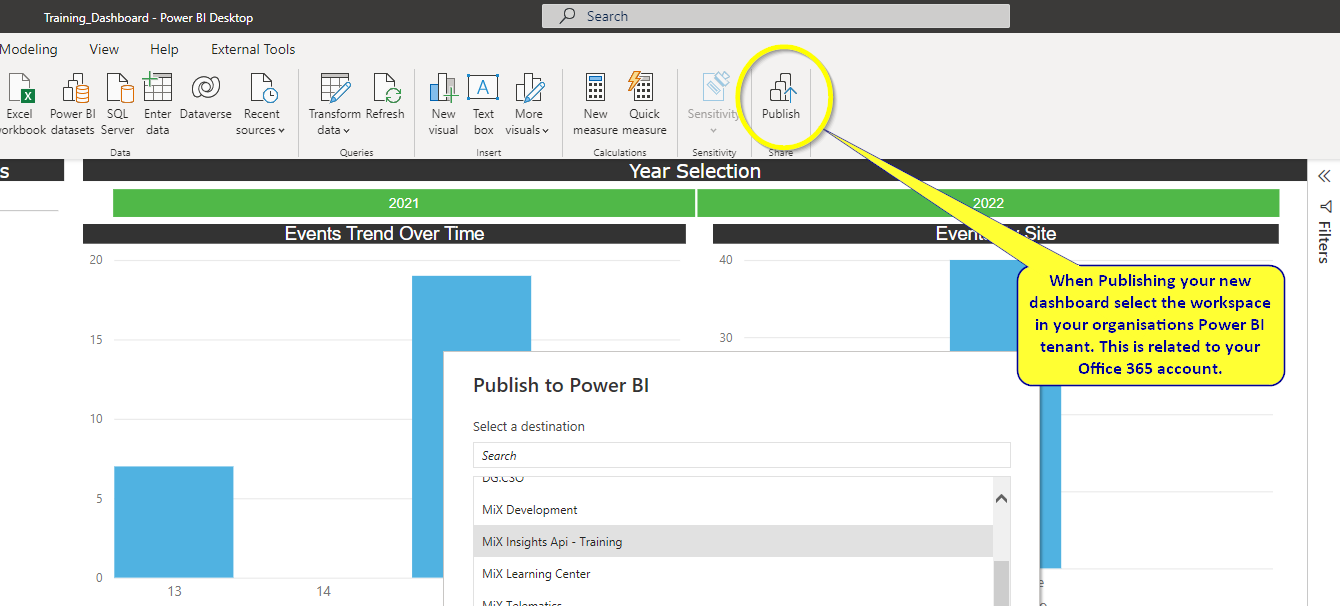
Click on the Publish button highlighted in the image below.
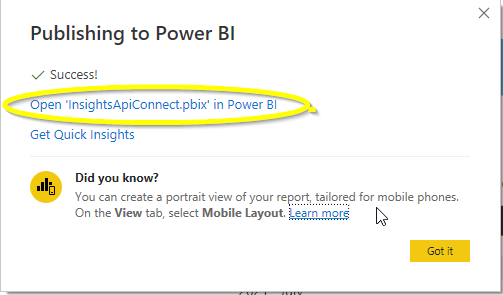
The following confirmation window will appear when the report has been published.
Click on the Open 'Your dashboard Name' link to go directly to the report in Power BI Online .
Configuring Power BI Online settings
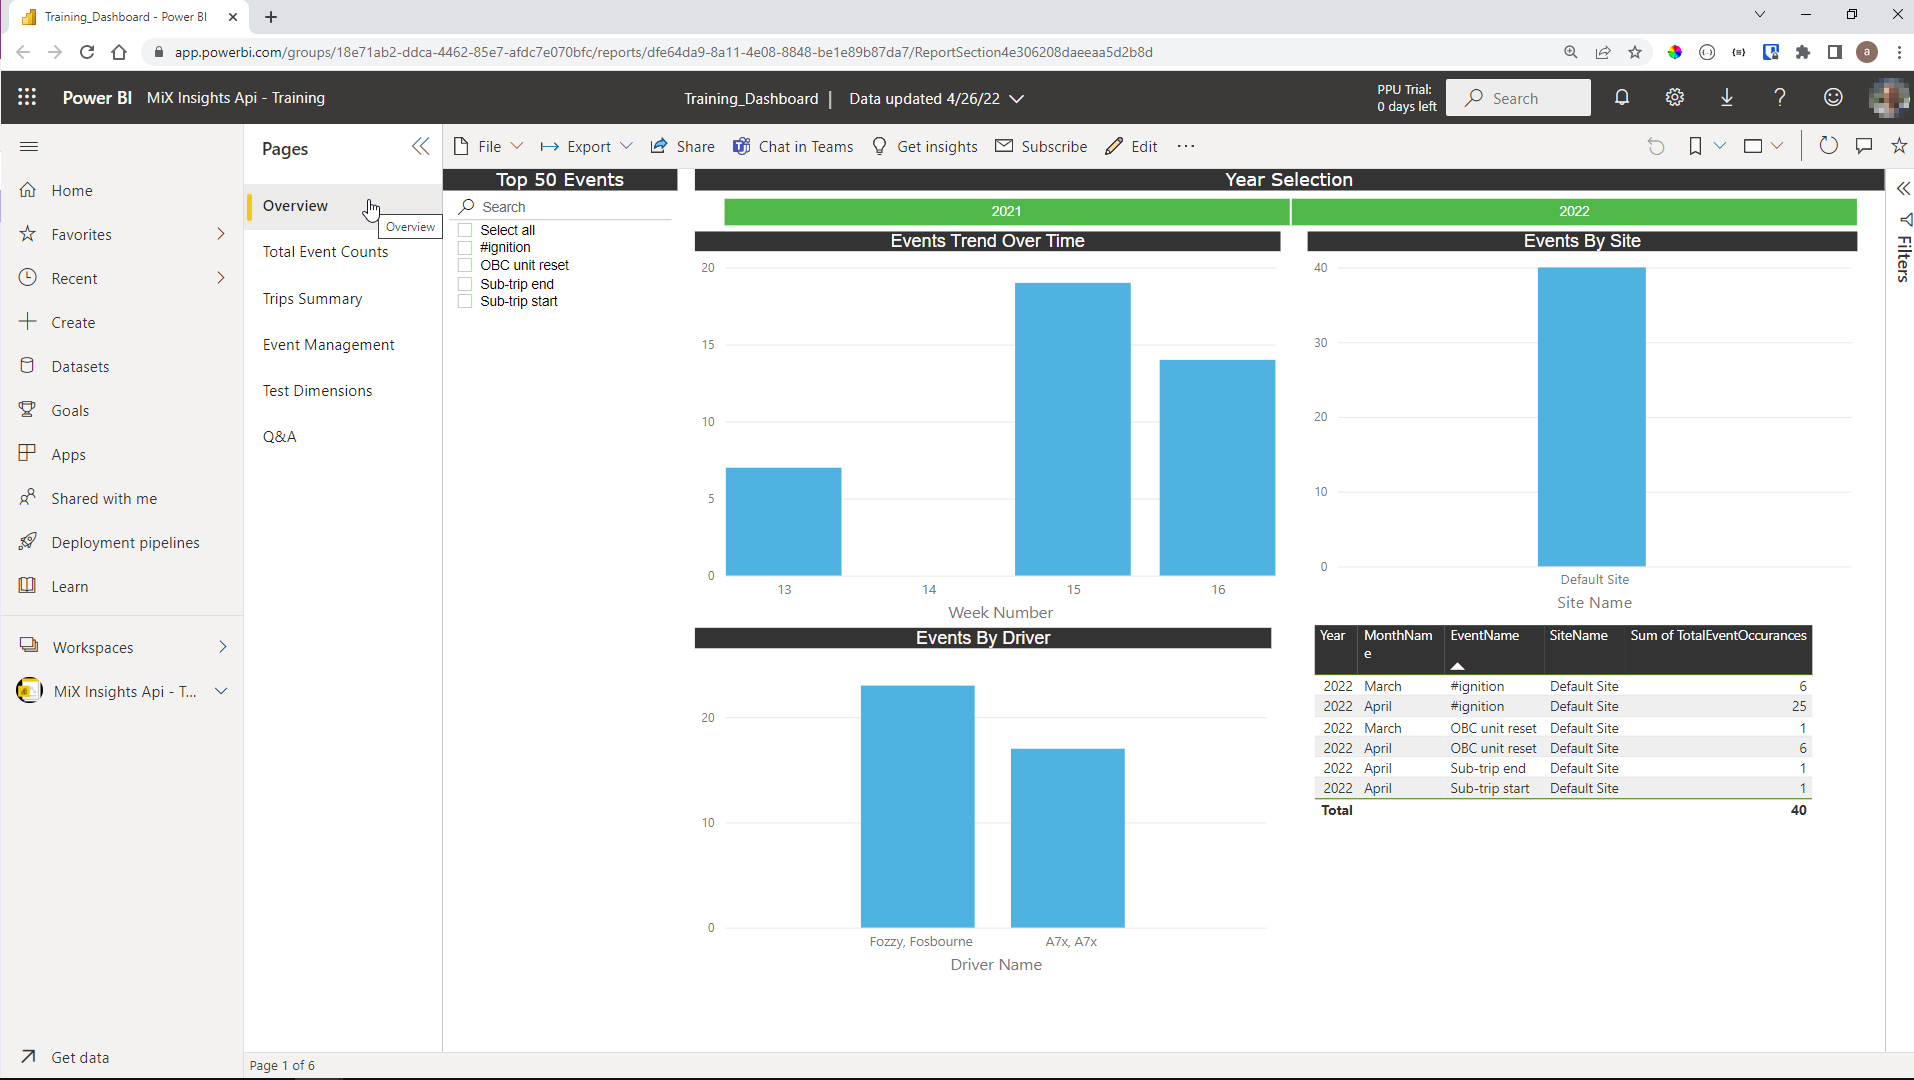
This is the default view of the report that we just published.
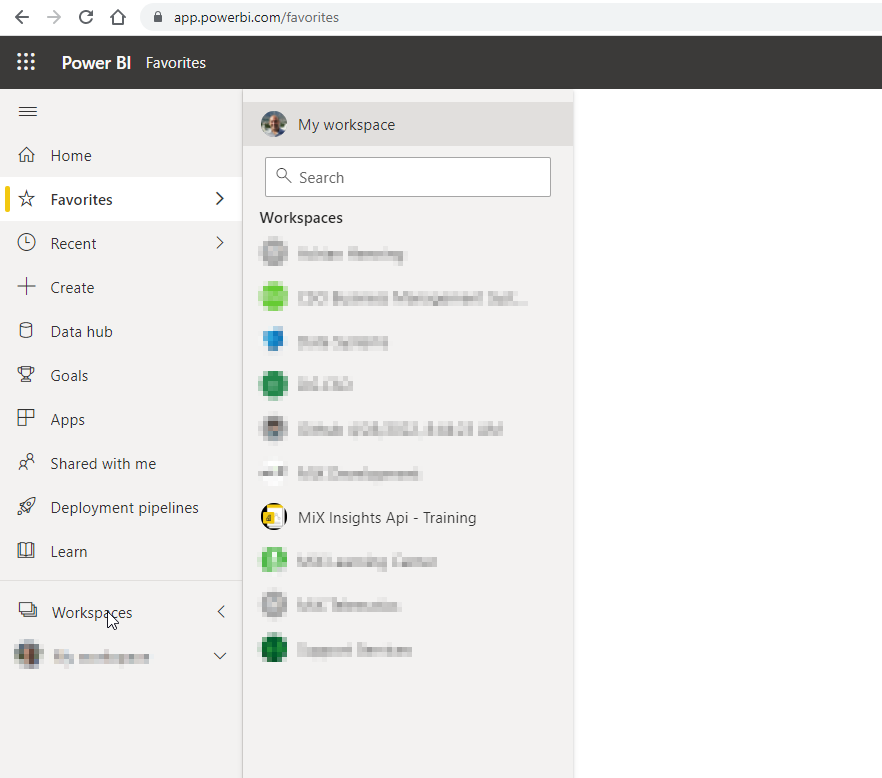
To set all the settings for the data source of this report: Navigate to the Workspace where you published the report.
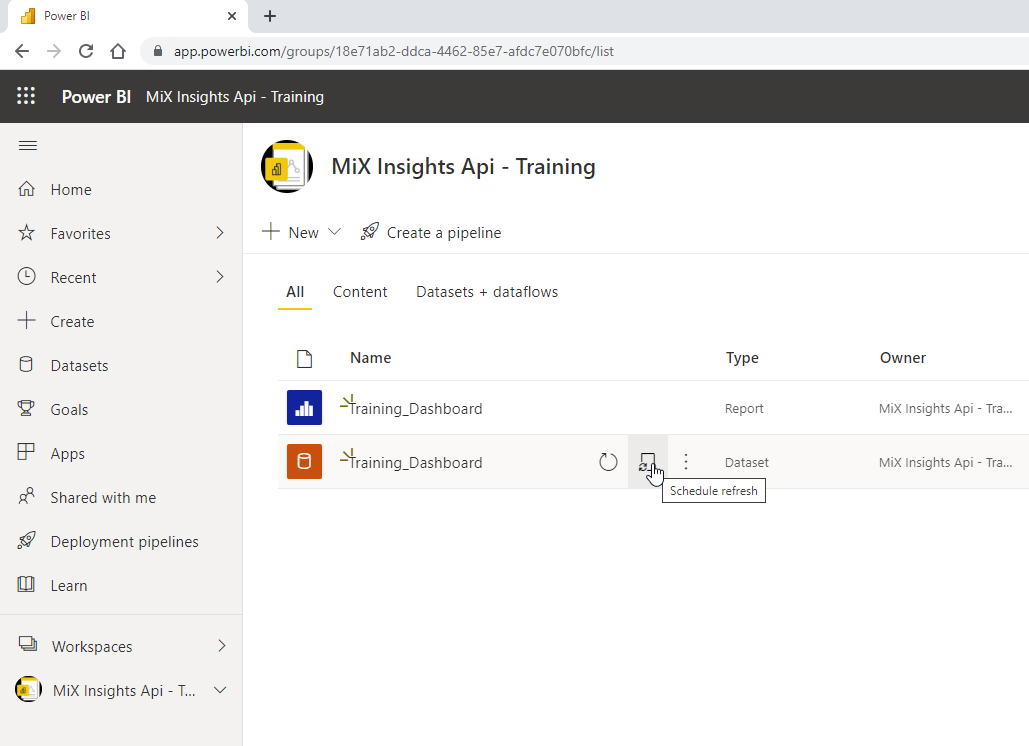
Once the correct Workspace was selected: Click on the "Scheduled Refresh" option as indicated below.
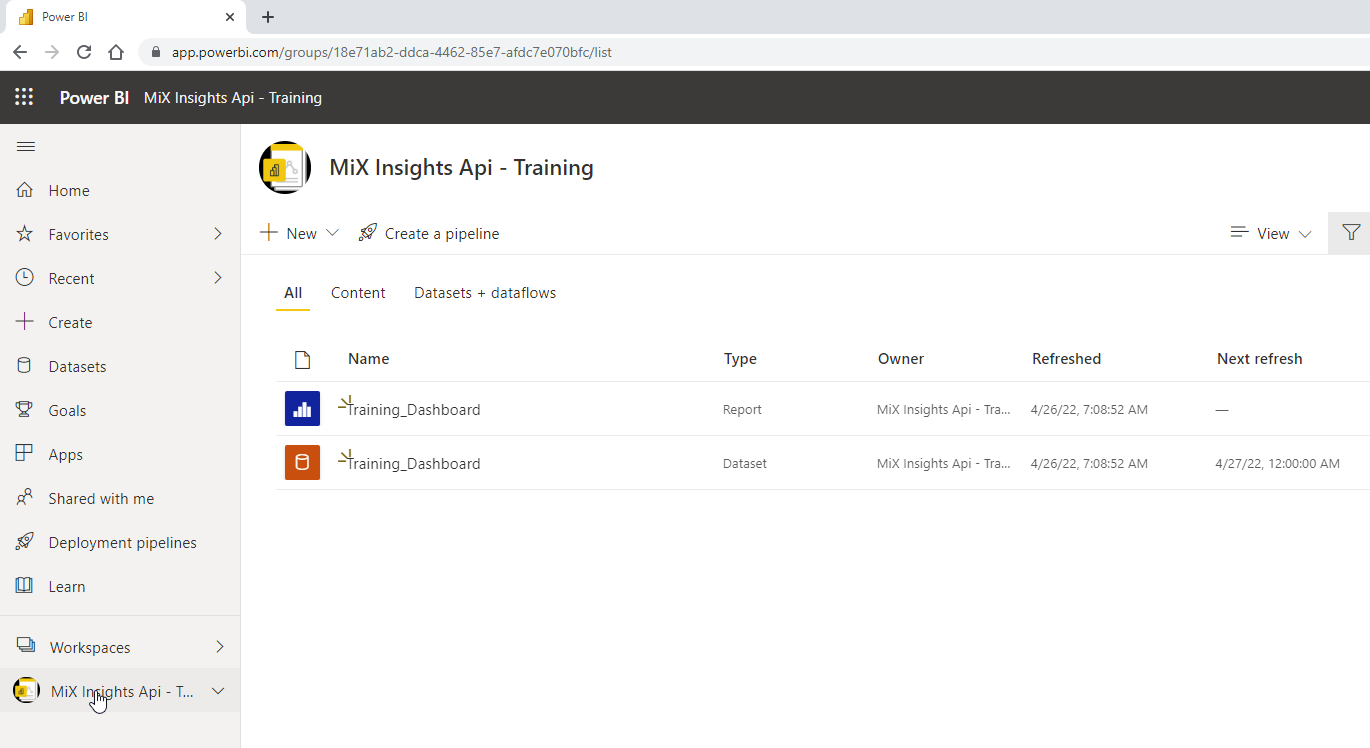
Note: The blue icon in the report we published, the red icon is its underlying data source. You could have many different reports pulling data from a single data source.
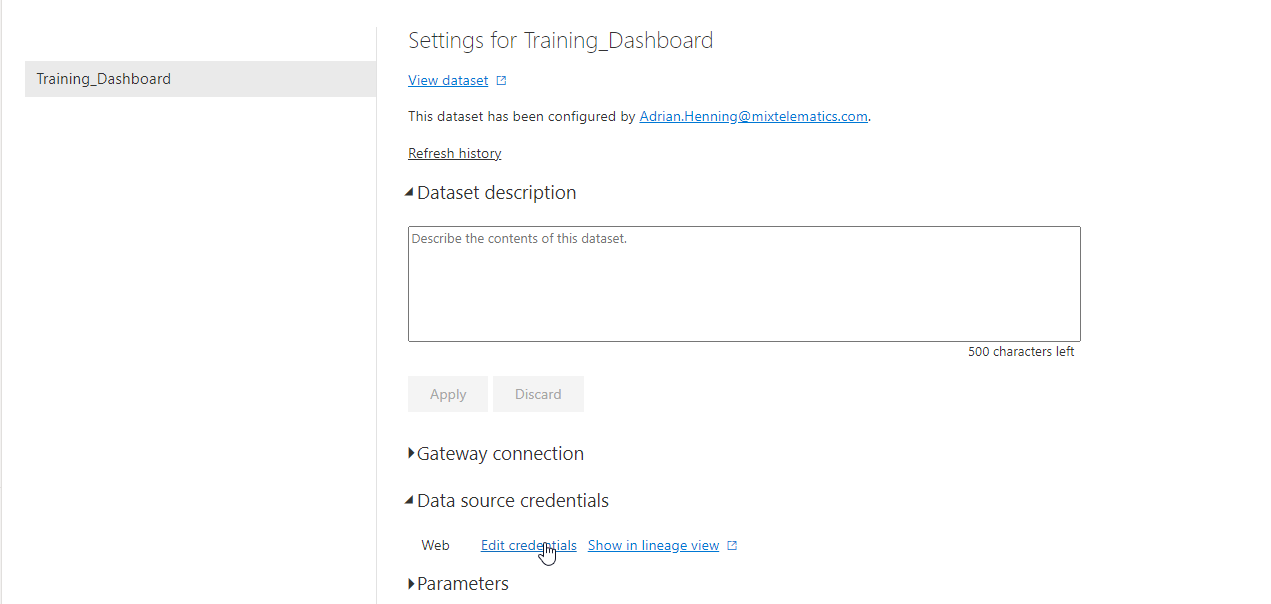
Expand the Data source credentials
Click on the "Edit credentials" option.
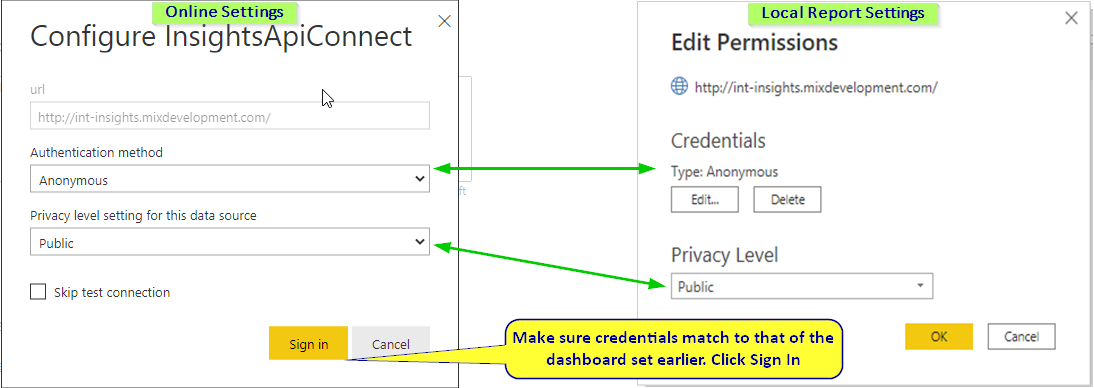
Configure the data source as indicated below.
You might notice that we are matching the data source settings done earlier in the desktop version to that of the online version that was published.
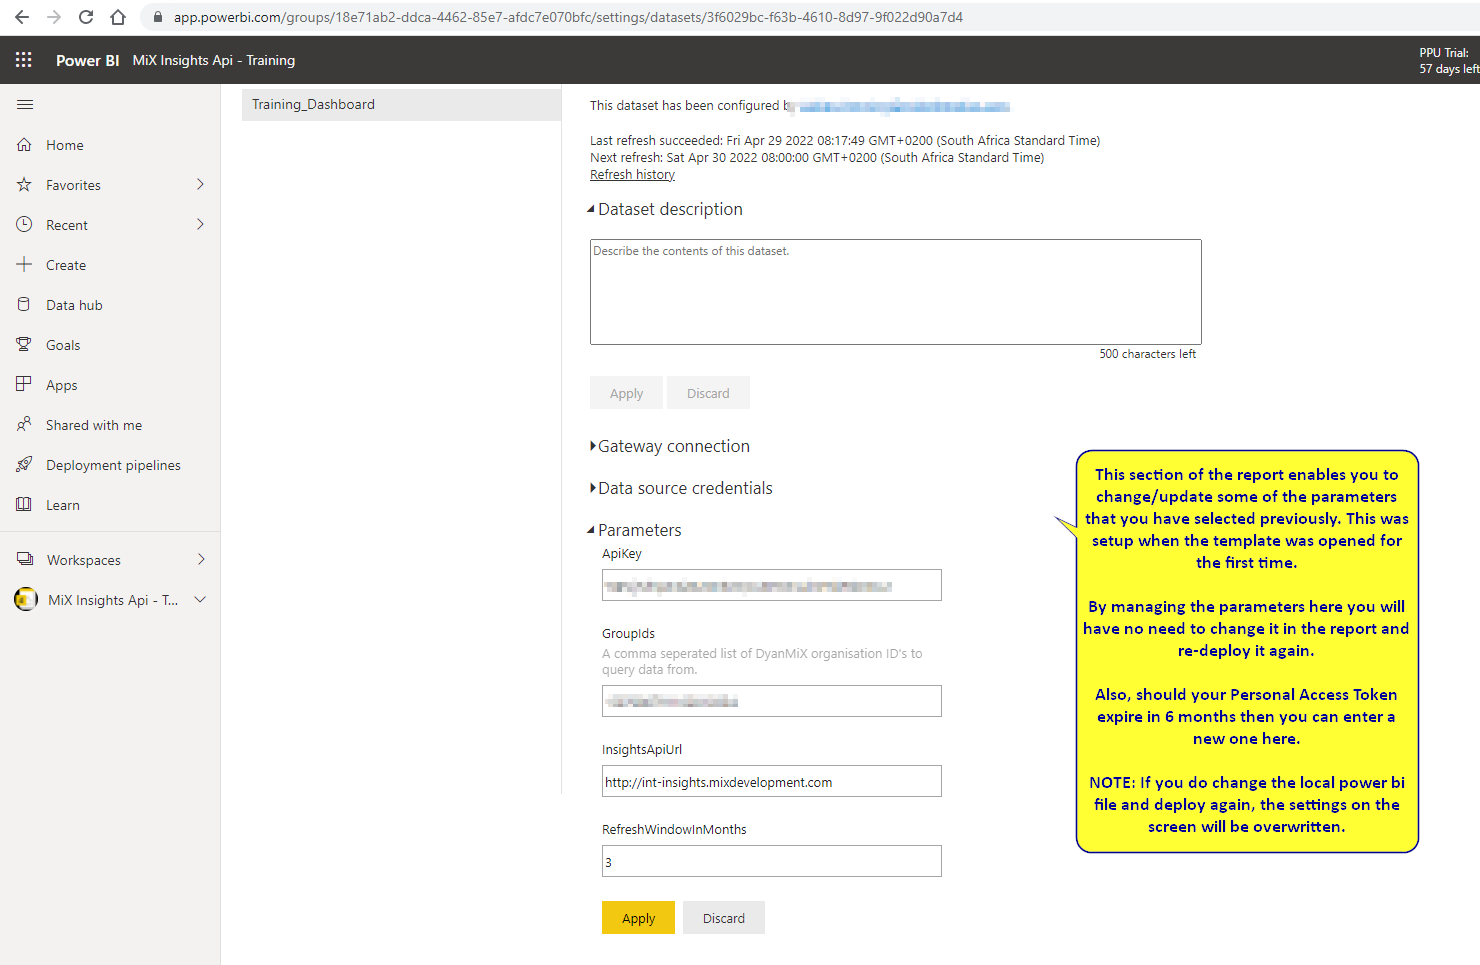
The parameters section should have the same values as the report we configured earlier. You can use this settings section to update the online parameters.
Make a note of the comments below.
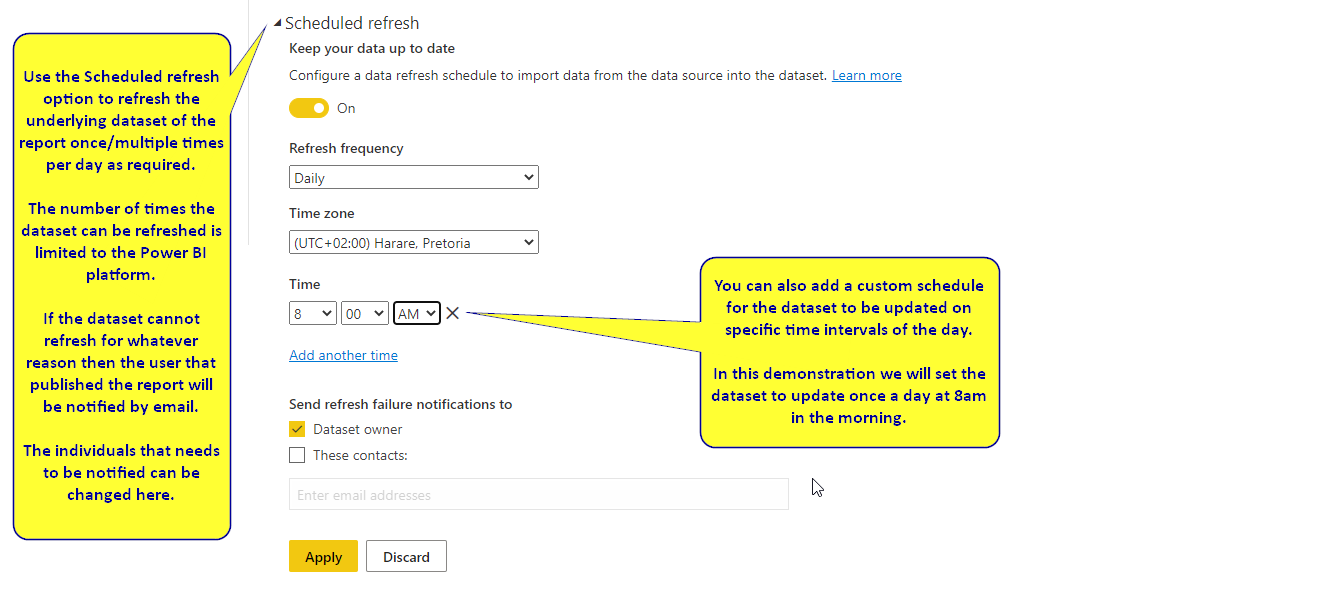
In the section below we will set up a daily refresh of the data source. This can be done once a day or at specific intervals of the day.
If there are any issues with getting the data from the underlying API then the user that published the report will receive a mail indicating that there is an issue with the data source.
Click on the Workspace menu again as indicated below.
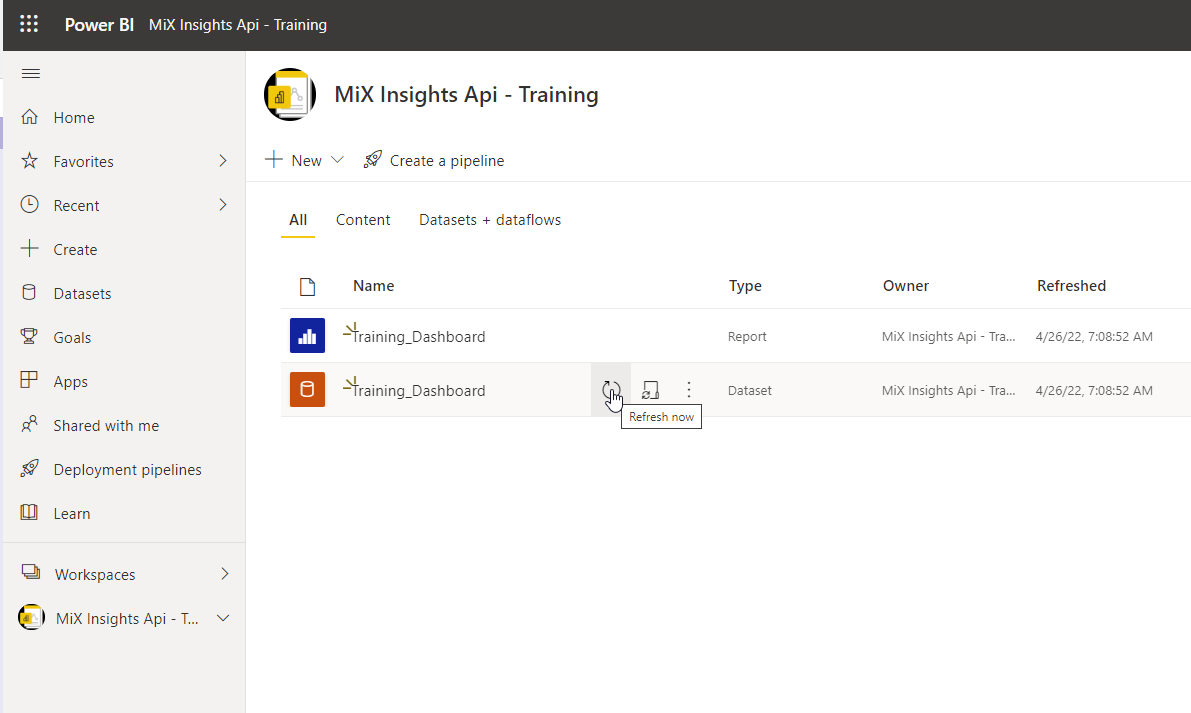
Click the "Refresh now" option as indicated below to manually update the dataset.
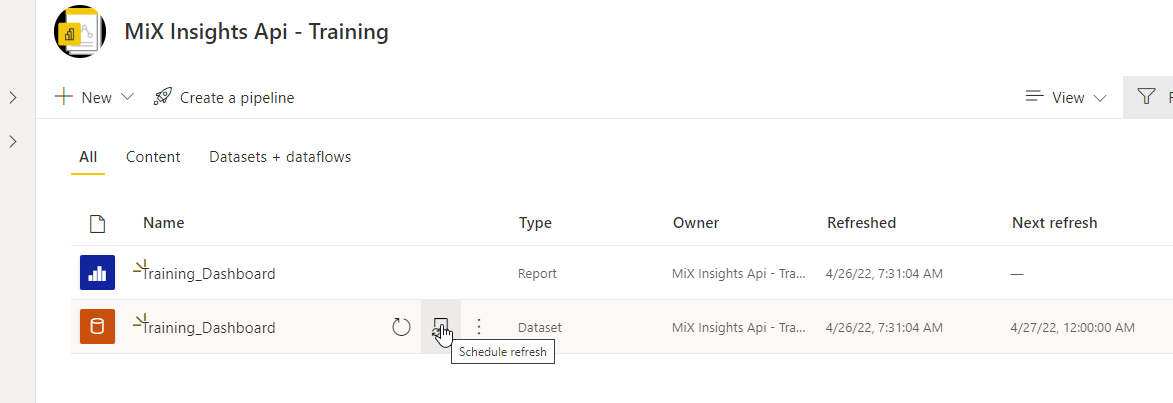
To see if the data sources was refresh correctly click on the "Scheduled refresh" option as indicated below.
From the Setting options click on "Refresh history" link as indicated below.
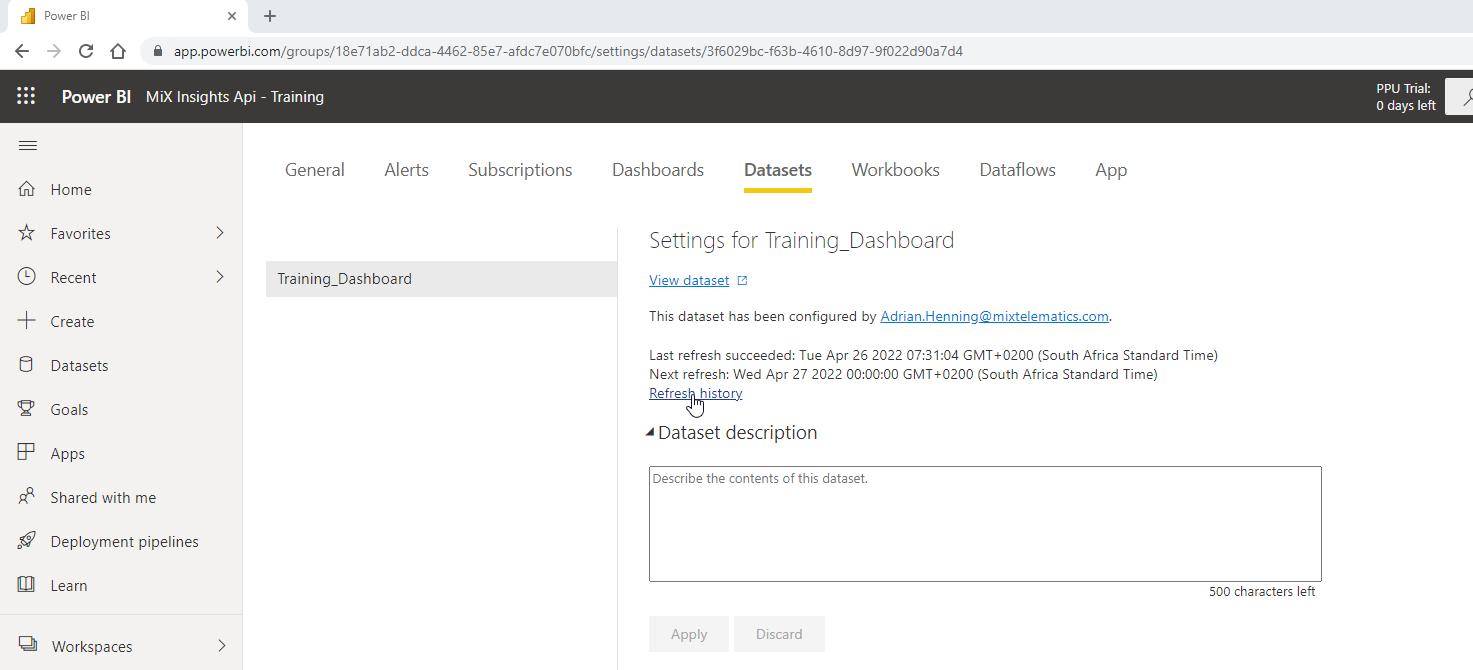
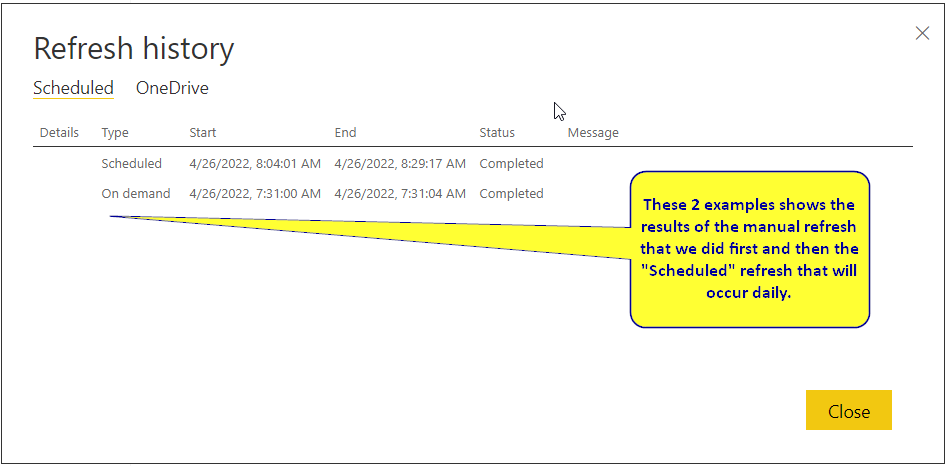
Select screen below indicates that the manual "Refresh now" option succeeded as well as the "Scheduled" option.
